

BEYOND THE HEADLINES: REAL-WORLD ECONOMICS
19TH EDITION

Hi everyone,
Welcome to the 19th edition of Beyond the Headlines.
In this issue, we pivot from our recent deep investigation into precious metals to a subject that might resonate: the potential economic fallout of escalating tensions in the Middle East. I’ll explore what this could mean for your finances, the hidden dangers of investor psychology, and the importance of reading between the lines of headline economic data.
In Part I, “Oil’s Crude Warning?”, I examine what recent escalations between Israel and Iran might teach us—specifically how oil prices have historically been a reliable predictor of U.S. recessions since 1971. I also look at the current vulnerability of the U.S. economy to an oil shock compared to 2022, when consumers still had pandemic-era savings as a buffer.
In Part II, “Oil Crises & The Impact”, I outline a scenario in which a renewed oil price shock—similar to those seen in 1973, 1979, 1990, 1999, 2008, and 2022—could unfold. I break down how key asset classes like gold, real estate, Treasuries, and the S&P 500 have historically performed during such crises, and why leaning on the traditional 60/40 portfolio could prove costly in such an environment.
In Part III, “The Pavlovian Market Effect?”, I explore how investor psychology has been conditioned over the past 15 years to expect that markets will “always bounce back.” This leads investors to take greater risks—not because fundamentals have improved, but because they are addicted to the relief of recovery. I’ll show why this mindset could leave many dangerously unprepared.
Finally, in Part IV, “Lies & Layoffs?”, I dissect the latest U.S. non-farm payrolls report. While headlines tout strength in the labour market, the underlying data tells a more fragile story. I also discuss the “illusion of truth” phenomenon—how repetition, not accuracy, shapes public belief—and why this makes critical thinking more essential than ever in navigating the noise.
As always, my goal is not to provoke fear but to help you prepare—by offering what I hope will be clear analysis of the deeper forces shaping our financial world. In times like these, discernment and honest assessment are more important than ever.
Storms test everything. But they also reveal true strength.
Wishing you resilience, wisdom, and a steady hand.
Sincerely,
Tom Bradshaw
“Panic is a sudden desertion of us, and a going over to the enemy of our imagination” ~ CHRISTIAN NESTELL BOVEE
“In investing, what is comfortable is rarely profitable” ~ ROBERT ARNOTT
Part I:
OIL’S CRUDE WARNING?
The Danger Zone Few See—Until It’s Too Late
Energy prices, inflation, geopolitical flashpoints—we’ve all seen countless headlines over the past few years. But last Friday’s 6% spike in oil prices, triggered by open military conflict between Israel and Iran, may be the most important warning yet.
Because beneath that one-day jump lies a deeper, more concerning question:
What happens if the world slips into oil’s “danger zone”—a zone that has almost always preceded U.S. recessions?
The Groundhog Day That Is An Oil Crisis
Since 1971, every time real (inflation-adjusted) oil prices have surged 30% or more above their 12-month average, a U.S. recession followed—with only one exception.
Think of that 30% surge as climbing above 8,000 meters on Everest:
Oxygen thins. Every breath is a struggle. Survival is not guaranteed.
History underlines it:
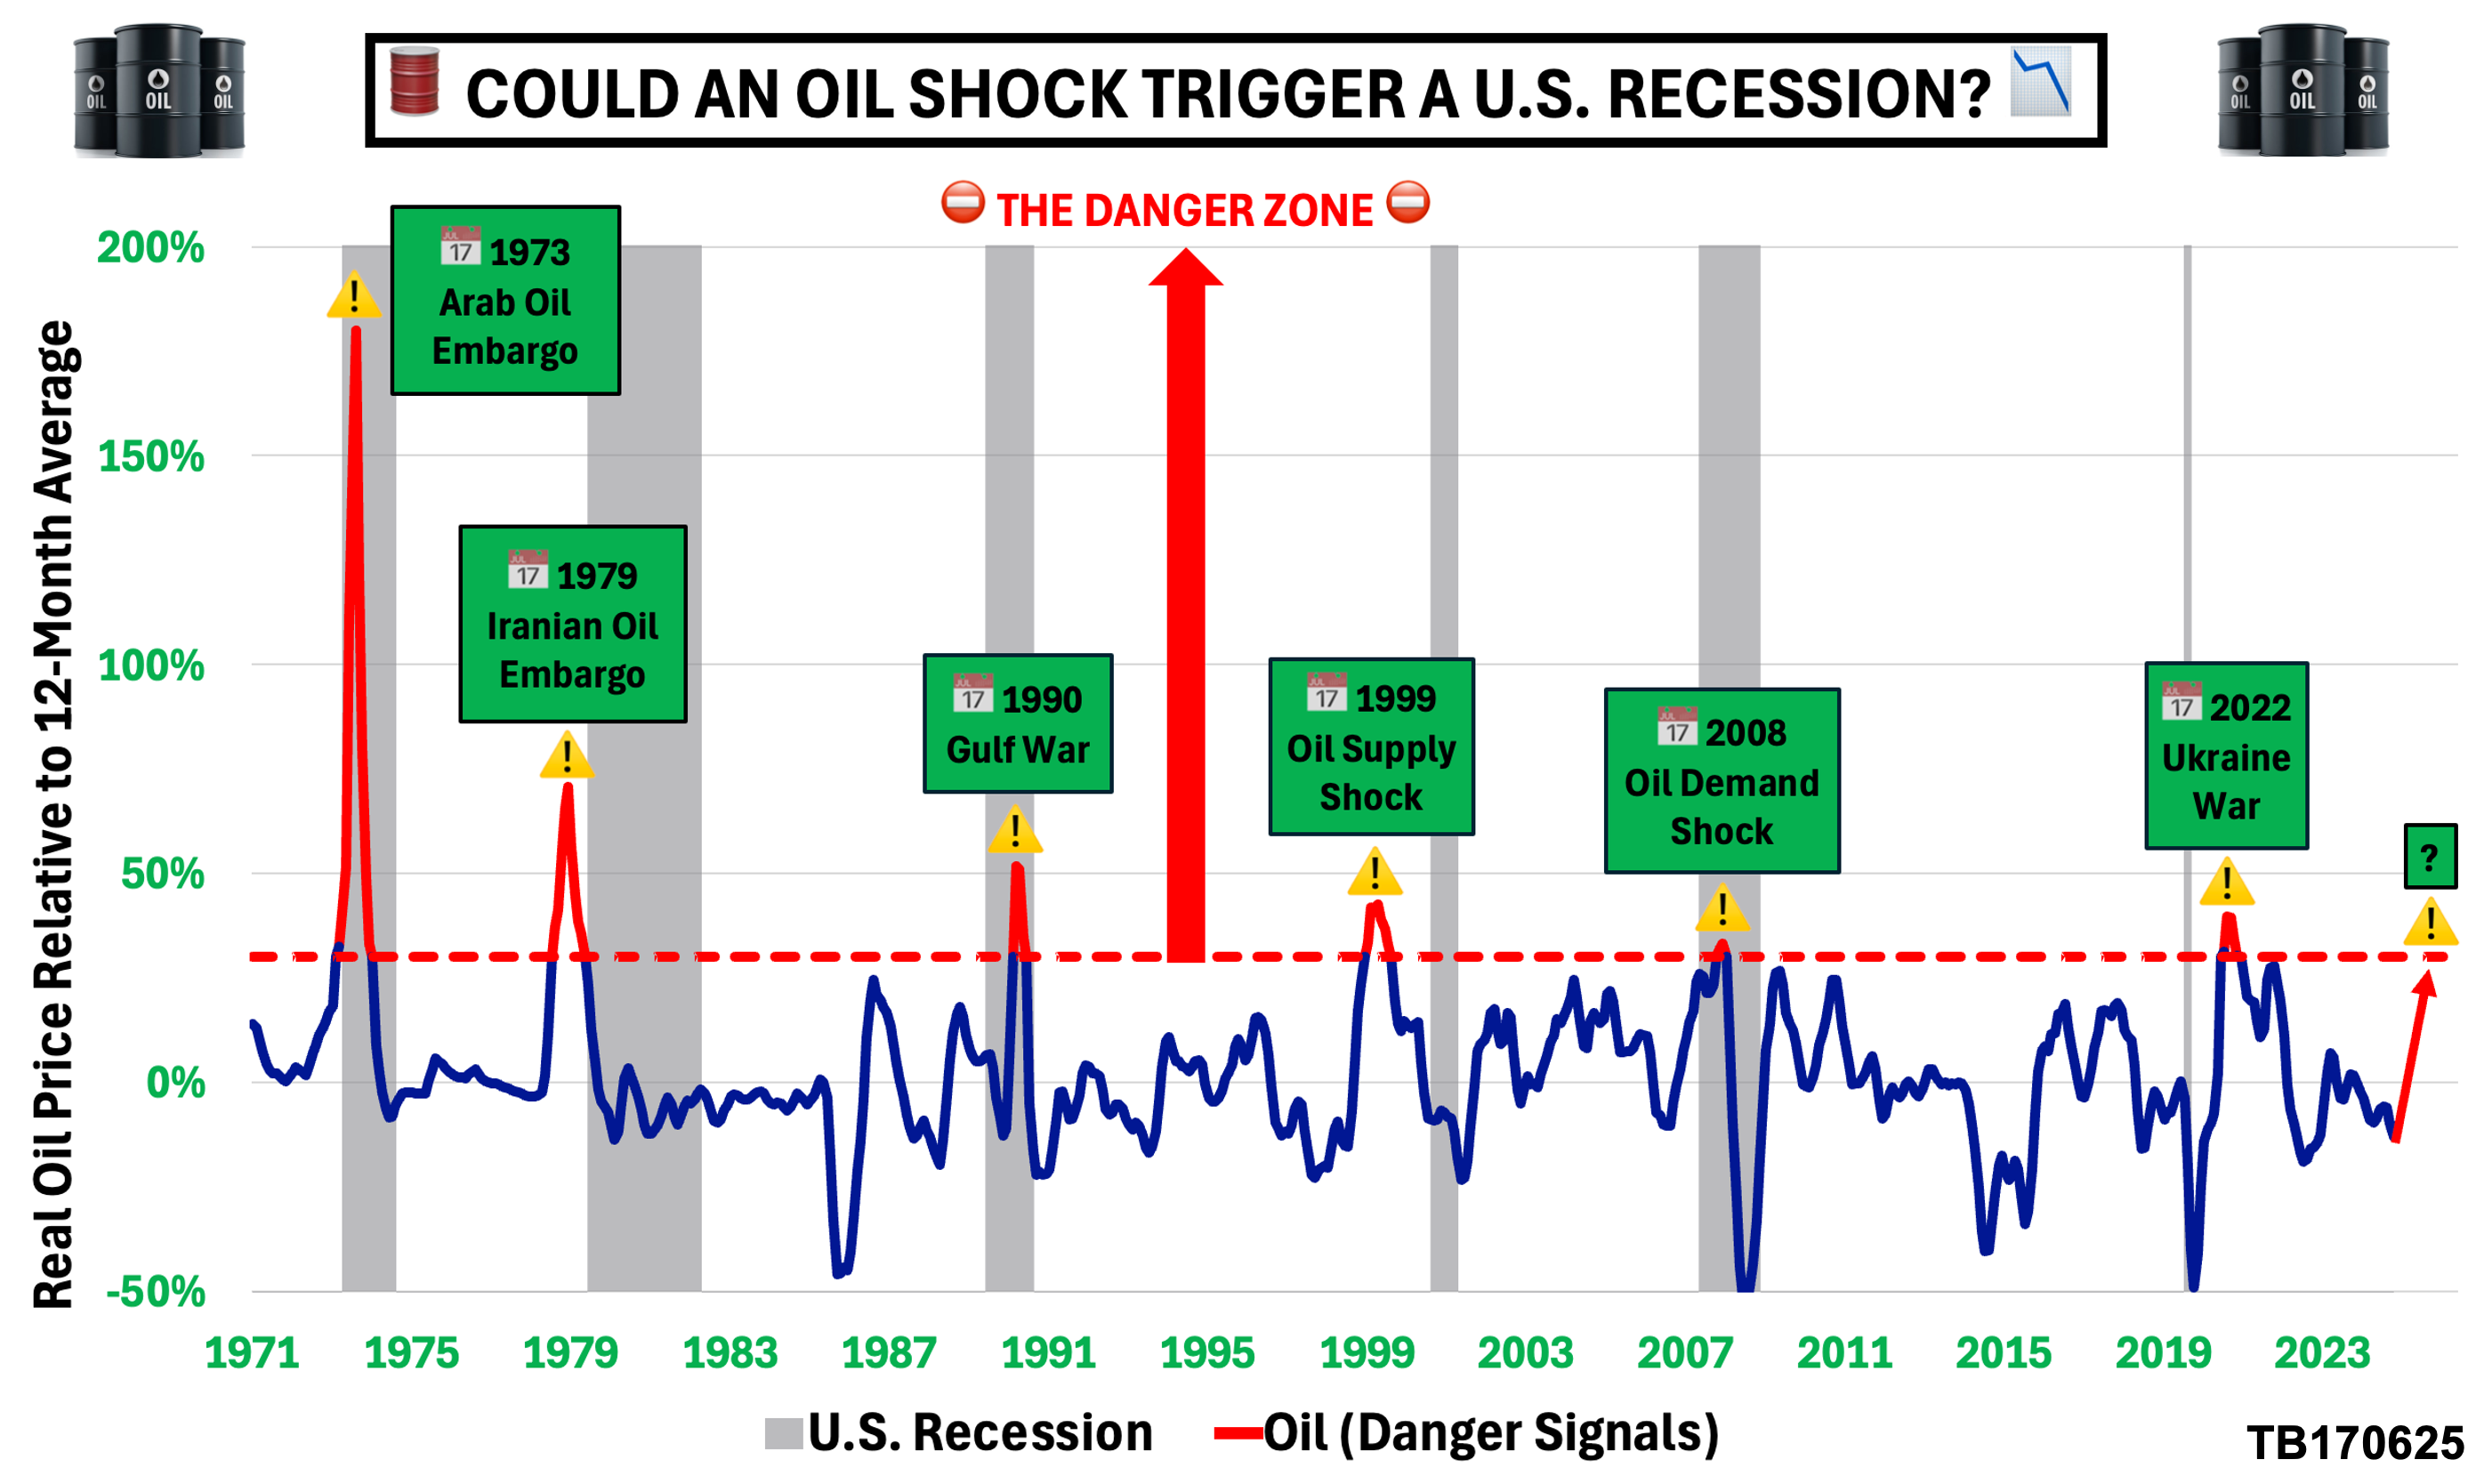
1973 | Arab Oil Embargo: +180% → Recession (1973–75)
1979 | Iranian Oil Embargo: +71% → Recession (1980–82)
1990 | Gulf War: +52% → Recession (1990–91)
1999 | Oil Supply Shock: +43% → Recession (2001)
2008 | Oil Demand Shock: +33% → Great Recession (2008–09)
2022 | Ukraine War: +40% → No recession (yet)*
* Why the asterisk?
Because in 2022, households still had pandemic-era savings—emergency oxygen that softened the blow.
But today? Oxygen appears to be running low.
Today’s Climb—More Treacherous Than Ever?
The International Monetary Fund (IMF) warns: every 10% rise in oil adds 0.4% to inflation in advanced economies.
Oil is now up 30% in a month—that’s an extra 1.2% in inflation—just as central banks are trying to cut interest rates.
Meanwhile, geopolitical risks are escalating:
Red Sea shipping lanes attacked by Iranian-backed rebels, adding weeks and millions of dollars to voyages.
The Strait of Hormuz—which carries 25% of global oil—under threat. A blockade, Goldman Sachs warns, could send oil soaring past $100 per barrel.
Are markets prepared?
Or are we sleepwalking into another crisis?
Are We Too Complacent?
We often hear the same reassurances:
“The Fed has the tools.”
“The job market is strong.”
“AI will save the day.”
But will those lifelines hold?
Can households and businesses survive another oil shock without the cushion of savings?
Can central banks truly navigate another wave of inflation, rising costs, and supply chain chaos?
In 2022, stimulus and savings acted as a safety net.
Today—the fixed ropes are fraying and oxygen is in short supply.
Final Thought
In the history of oil prices, crossing the 30% danger line is where the air turns perilously thin. Past generations didn’t always see it coming—until it was too late.
Are we climbing higher today—with no rope, little oxygen, and growing risks?
Part II:
OIL CRISES & THE IMPACT
What Another Oil Crisis Might Mean For Your Finances
In Part I, we looked at rising tensions between Israel and Iran—and the potential economic fallout. Now, let’s zoom in on what a potential oil price shock could do to your portfolio.
The Warning Signs
Think back to past oil price shocks: 1973, 1979, 1990, 1999, 2008, 2022—each one sent markets and households reeling: higher fuel costs, inflation, falling stocks, rising borrowing costs, stressed portfolios.
With Israel and Iran immersed in conflict, we must ask:
Could another oil crisis be looming?
The Crises That Changed Markets
Let’s recap:
1973: Arab Oil Embargo → soaring prices, tumbling stocks
1979: Iranian Oil Embargo → panic, inflation
1990: Gulf War → supply disruptions, market volatility
1999: Oil supply shock rocked markets
2008: Oil demand shock rattled markets before global financial crash
2022: Ukraine war → oil prices spiked again
Each time, real oil prices surged 30%+ above their 12-month average. That’s my benchmark for a true oil crisis.
What History Tells Us About Portfolios
Here’s the blunt truth: when oil spikes, most portfolios suffer.
Average real (inflation-adjusted) returns during past oil crises:

Gold: +32%—the standout performer, a trusted safe haven
Real Estate: -2%—pressured by rising interest rates
Treasuries: -7%—inflation and higher rates eroded bond returns
S&P 500: -13%—stocks hit by inflation and falling company margins
Bottom line: The traditional 60/40 portfolio (60% stocks, 40% bonds) tends to falter in an oil crisis.
Gold: The Crisis Champion
Gold has outperformed in 5 of 6 oil crises—up +84% in 1973 and +69% in 1979, the two biggest oil price shocks.
Why? Gold holds value when inflation surges and markets panic.
Question: Is your portfolio ready with a meaningful gold allocation?
Real Estate: The Mixed Bag
Real estate delivers mixed results in oil crises:
Positive in 3 of 6 episodes
Negative in 3 of 6
Why? Higher borrowing costs (from rising rates) often offset real estate’s inflation-hedging benefits.
Question: Are you prepared for the impact of higher rates on property values?
Stocks & Bonds: The Big Letdowns
Higher oil prices → higher inflation → hawkish Fed → falling bond prices and squeezed stock earnings.
Examples:
S&P 500: -25% in 1973 (biggest oil price spike)
Treasuries: -13% in 1979 (second-biggest oil price spike)
Question: Are you overexposed to traditional paper assets?
What If Israel-Iran Tensions Escalate Further?
Based on history, here’s what could happen:
S&P 500: Potential sharp declines from company margin pressure
Treasuries: Likely losses from higher yields as inflation expectations rise
Real Estate: Limited inflation hedging protection, but vulnerable to higher rates
Gold: Likely standout performer due to inflation hedging and safe haven appeal
What Can You Do Right Now?
Escalation isn’t guaranteed. But are you happy to wait and get caught flat-footed?
Here’s your checklist:
Are you diversified into inflation-resistant assets?
Have you trimmed exposure to traditional stocks and bonds?
Is your gold allocation ready for a potential oil-driven spike in inflation?
The Bottom Line
When oil prices surge:
Gold outperforms
Stocks and bonds struggle
Real estate is a wildcard
My advice? Don’t just react—prepare.
Part III:
THE PAVLOVIAN MARKET EFFECT?
Why We Keep Falling For The Same Old Market Trick
In Parts I and II, we looked at the economic and financial implications of rising tensions in the Middle East. Now, we turn our attention to a dangerous psychological behaviour that investors have exhibited for well over a decade.
The Market Rollercoaster

Last Friday, markets twitched as tensions between Israel and Iran sharply escalated. The S&P 500 dropped over 1% and uncertainty gripped investors worldwide.
Headlines screamed danger. Concern rippled through every portfolio.
Then, almost as if on cue, by Monday stocks surged back.
The S&P 500 rallied 1%, optimism flooded back, and investors cheered. Headlines flashed relief.
But honestly? I can’t help but pause.
The Conditioning Cycle—Markets On A Behavioural Loop
For the past 15 years, markets have been caught in a predictable behavioural cycle. Every shock—whether they were debt ceiling standoffs, rate hikes, pandemics, tariffs, or geopolitical flare-ups—sparked a sharp sell-off.
Then, just when it felt like the floor had fallen out, the cavalry arrived: central banks have intervened, policymakers have issued calming words, or diplomatic efforts have eased tensions….in the short-term.
Here are three prime examples:
2011 Debt Ceiling Crisis: S&P 500 dropped 22% over five months → it fully recovered in four months
2018 Rate Hikes: S&P 500 fell 20% in three months → it rebounded fully within four months
2020 Covid Crash: A brutal 34% drop in one month → there was a full recovery in five months
Loss. Pause. Rebound. Again. Again. Again.
This is Pavlovian investing—a psychological reflex where loss aversion meets dopamine. Yet investors parade around as if they’ve just survived The Great War.
Psychological Whiplash: From Panic To Euphoria
First, it feels like the ground shifts beneath us—market stability ripped away by geopolitical uncertainty.
Then suddenly, it’s handed back—through soothing diplomatic statements or a “no escalation” narrative.
The rational response? Neutrality. We’re only back where we started. Risks remain firmly on the radar. But what happens? We erupt with euphoria!
We don’t just breathe a sigh of relief. Because we have been conditioned to crave comfort, we double down. The concern, of course, is that this emotional whiplash blinds us to the risks that still lurk beneath the surface.
The Cost Of False Courage: When Temporary Relief Becomes Deception
Each time fleeting relief is mistaken for a true fix, we weaken our ability to manage real risk.
We fixate on headlines, not fundamentals.
We chase surface signals while ignoring fault lines growing deep beneath the market’s surface.
This isn’t investing. It’s dopamine-driven speculation stuck in a feedback loop—one that leaves us exposed when the music stops.
Today’s Fragile Market Structure
Look closer, and the fragility is glaring:
Extreme Valuations: The S&P 500 is priced near levels last seen before the catastrophic 86% crash of 1929-32—an ominous signal.
Rising Geopolitical Risks: Echoes of protectionism and conflict in the Middle East recall dangerous historical precedents that destabilised markets and global peace during the 1930s and 1970s.
Prolonged Monetary Tightening: The Federal Reserve’s restrictive policies have lasted longer than any time in U.S. history—even longer than the run-up to the Great Depression, when unemployment later surged to an unprecedented 25%.
What Happens When The Cavalry Doesn’t Arrive?
Markets have been trained to believe, “It always comes back.”
But that’s not risk management—it’s psychological dependence disguised as resilience.
What if this time the dip isn’t bought?
What if diplomatic efforts fail, and conflict escalates?
What if the “threat” finally becomes reality?
That’s when the Pavlovian market effect kicks in—and investors face the abyss, unprepared.
Part IV:
LIES AND LAYOFFS?
What Happens When The Truth Is No Longer Real?
In Parts I to III, we explored the rising tensions in the Middle East and the dangers of the Psychological Pavlovian Market Effect. Now, we turn to the latest U.S. non-farm payrolls report—and why it’s more critical than ever to look hard at the numbers we’re fed.
The Soothing Story We’ve Been Sold

There’s a story we’ve heard so often, it’s hard not to believe: the U.S. economy is steady, strong, and inching toward a “soft landing”—a gentle slowdown after Trump’s tariff tantrum this spring.
The headlines reinforce it:
Job growth is steady
Unemployment remains low
Inflation is cooling
And beneath it all: American exceptionalism lives on.
But what if this feel-good narrative is a lie—one repeated so often we’ve stopped questioning it?
What The Headlines Want You To Believe
Recent reports boast “resilient” job numbers:
139,000 new jobs in May
Unemployment “steady” at 4.2%
If you skim the headlines, you might think: the economy’s fine—maybe even feel hopeful.
But What The Headlines Don’t Tell You
Those rosy numbers hide a darker truth.
Job growth figures have been quietly revised down—95,000 jobs erased from March and April.
And that “steady” unemployment rate? An illusion. The labour force participation rate dropped by 0.2%. Tens of thousands didn’t land jobs; they stopped looking. Some retired, but many more are discouraged, disillusioned, worn down by a market that feels rigged.
Why We Believe The Lie
This is the illusion of truth. Psychologists Tom Stafford and Lisa Fazio show that repeated messages—true or false—become familiar, and familiarity becomes fact.
So when the news repeats “resilient jobs” and “strong labour market,” we believe it—even if our gut says otherwise.
The Harsh Reality
Between April 2023 and March 2024, nearly one million jobs were revised out of the data—roughly 80,000 jobs erased each month.
May’s “strong” 139,000 jobs? After revisions—closer to 95,000. Does that sound like a booming economy?
Wall Street’s Cheer—And What It Ignores
Each time a “resilient” jobs report hits, the stock market rallies. But Wall Street conveniently ignores what’s really happening: constant downward revisions and a shrinking labour force masking the true story.
Why We Keep Living The Lie
Because the truth doesn’t fit the narrative.
So even if you know, deep down, that headlines are being massaged, stories spun, it’s a storyline that lets you sleep at night.
Comfort without truth, though, is a dangerous bargain.
When the revisions pile up, when the pain finally hits your paycheck or your portfolio, where do you turn?
The Real Cost Of Economic Storytelling
When headlines twist reality, the damage is real:
Trust in institutions shatters
Struggles of ordinary people are ignored
Bad policies are made based on lies
The public becomes numb to the truth—until it’s too late
And once trust is broken, it’s nearly impossible to rebuild.
What Can You Do?
Next time you see a U.S. jobs headline—don’t skim.
Look deeper.
Ask questions.
Are people really finding work—or have they stopped looking?
Is unemployment steady because the economy is strong—or because the workforce is quietly shrinking?
Because what May’s report really reveals isn’t resilience. It’s a warning that an economy is quietly deteriorating while the comforting lies we hear every day lull us to sleep.
RISK DISCLAIMER
Past Performance – Future Performance
No Guarantees: Past performance is not an indicator of future results. Exercise caution when evaluating performance as all financial products are influenced by market forces and unforeseen events that may impact future outcomes.
Future Projections: Future performance predictions are not guarantees of past or current performance. Assess future claims cautiously, as they rely on assumptions. Like all financial products, this product is subject to market forces and unpredictable events that may affect future performance.
General Advice
Educational Purposes: The information in this report is for educational purposes only. Any advice provided is general and does not consider your personal objectives, financial situation, or needs. You should evaluate the appropriateness of the advice in light of your own circumstances before acting on it.
Investment Decisions
Risk Awareness: Investment decisions, including buying, selling, holding, or trading securities and other investments, carry risk and should be made with the guidance of qualified financial professionals. Trading, especially day trading, involves substantial risks and can result in significant losses. Consult a qualified financial professional before starting any trading program to determine if it is suitable for your financial situation and risk tolerance.