LOST IN SPACEX?
Three IPO Cycles. Three Peaks. One Recurring Market Pattern

Last month, SpaceX launched the largest IPO in history - and Wall Street has been celebrating.
But one question worth asking is:
Are we witnessing genuine innovation… or the final stage of market euphoria?
Almost always, history offers an intriguing perspective.
Some of the largest IPO events have arrived at moments when optimism, speculation, and valuations were already stretched to extremes.
And each time, the market paid the price.
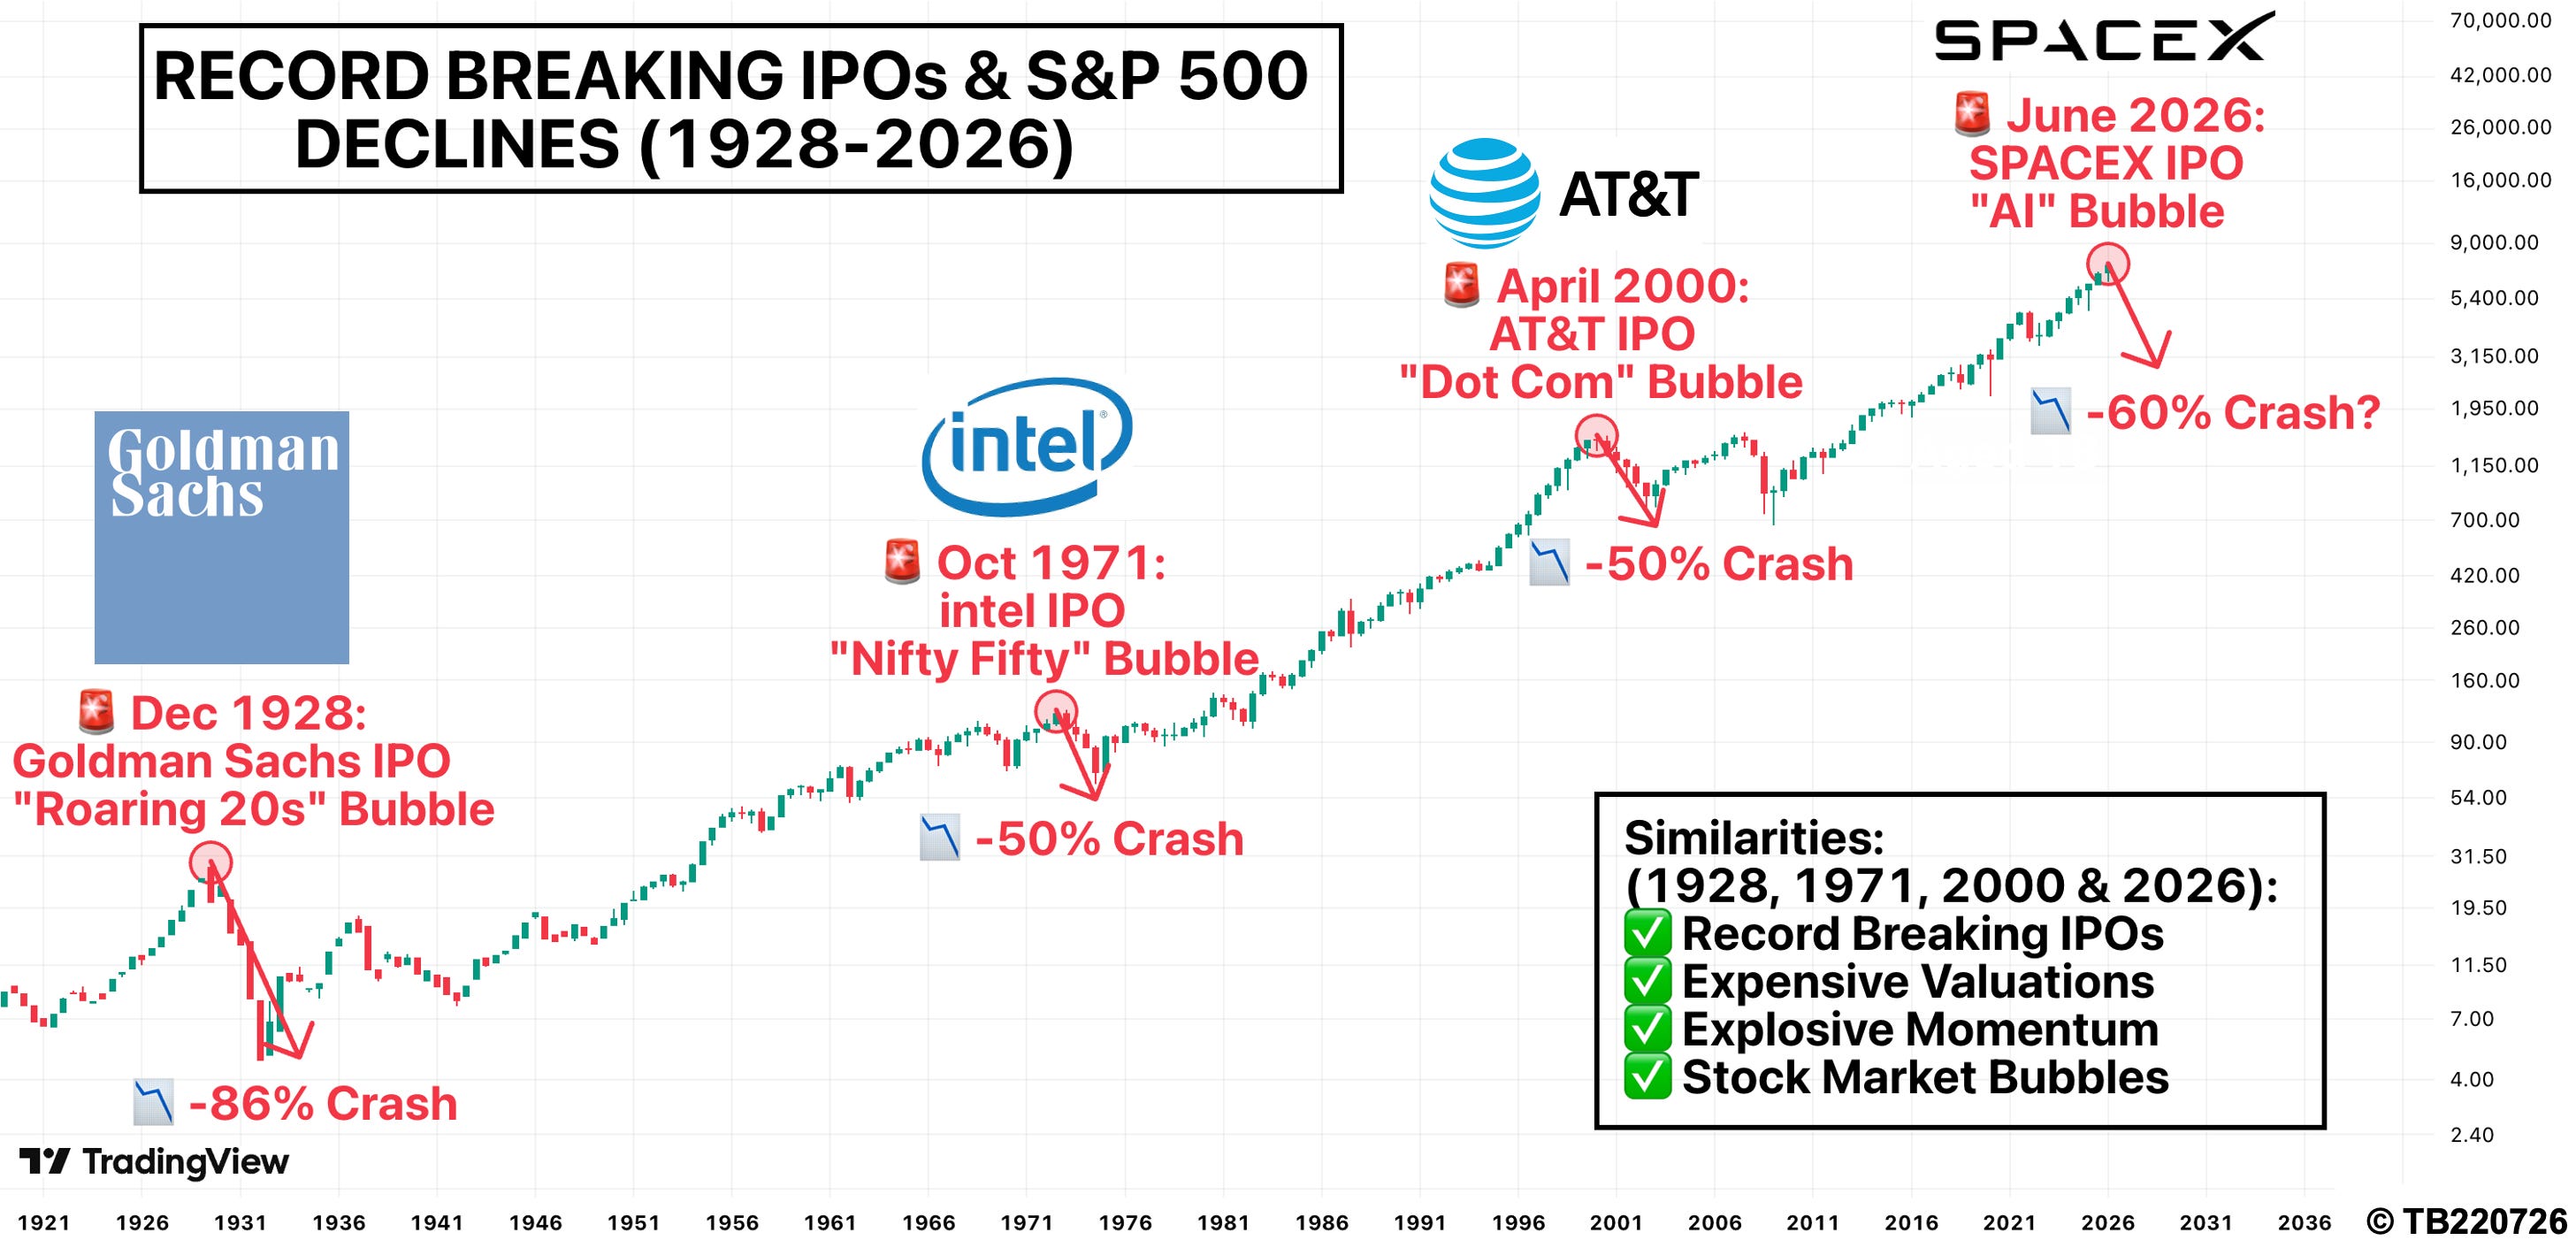
1928: The “Roaring Twenties” Bubble
In December 1928, the Goldman Sachs Trading Corporation was launched. A record number of shares were sold to the public during one of the greatest stock market booms in history.
Between 1927-29, the S&P 500 surged 90%.
Investor optimism reached stratospheric levels, while valuations became severely stretched, with the S&P 500-to-U.S. GDP ratio climbing to 28% - 180% above its long-term median of 10%.
Then came the turning point…
Black Tuesday.
The S&P 500 fell 22% in just two trading days. The Great Depression followed, and between 1929-32 the index collapsed by 86%.
Investors then had to wait 26 years before inflation-adjusted highs were finally exceeded in 1955.
1971: The “Nifty Fifty” Bubble
In October 1971, Intel went public.
Once again, IPO enthusiasm was widespread and investor confidence exceptionally strong.
Between 1971-73, the S&P 500 advanced 80%, while the S&P 500-to-GDP ratio reached 13% - 30% above its historical median.
Then the market turned…
Between 1973-75, the S&P 500 declined by 50%.
Investors waited 18 years before inflation-adjusted highs were regained.
2000: The Dot-Com Bubble
In April 2000, AT&T launched its IPO.
Once again, optimism and speculation reached extreme levels.
Between 1998-00, the S&P 500 rose 70%, while the S&P 500-to-GDP ratio climbed to 16% - 60% above its long-term median.
Five months later, the market peaked…
The Dot-Com crash followed.
Between 2000-02, stocks fell 50%, and investors waited 16 years for inflation-adjusted highs to return.
2026: The AI Bubble?
SpaceX recently launched the largest IPO in history.
And it has taken place when AI enthusiasm is at fever pitch.
The S&P 500 has already risen 60% over the past two years.
Meanwhile, valuations remain exceptionally elevated, with the S&P 500-to-U.S. GDP ratio standing at 25% - 150% above its historical median.
The Historical Pattern
Looking back at the three IPO episodes that preceded major market peaks, two characteristics stand out:
Valuations were elevated.
Market momentum was exceptionally strong.
It’s well worth noting that every previous peak occurred when:
The S&P 500-to-GDP ratio stood at least 30% above historical norms.
The S&P 500 had already risen 60% or more during the preceding two years.
The Big Question
If parallels with the past reemerge, are we looking down the barrel at another major correction?
Looking back at the three major post-IPO market peaks examined above, the S&P 500 subsequently declined by an average of 60%, with the downturn unfolding over two years.
Applied to today, that would imply the S&P 500 could fall from 7,500 to 3,000 points between 2026-28.
But perhaps the bigger concern is this:
Following those three previous post-IPO peaks, investors had to wait an average of 20 years before inflation-adjusted highs were regained.
If the pattern were to repeat again, the S&P 500 might not surpass its current inflation-adjusted peak until 2046.
We should all understand risk and reward. And we should also understand that with the potential for higher returns comes the higher probability of loss.